Chapter 2 Some basic R tasks
By now, you should be familiar with RStudio’s layout. In this chapter, we’ll cover basic tasks in R: importing data, exploring built-in datasets, summarizing data, accessing help files, and interpreting common errors.
2.1 Using R’s Built-In Datasets
Built-in datasets like ChickWeight can be loaded and explored:
data(ChickWeight)  # Loads the dataset into memory
ChickWeight        # View dataset in the console
View(ChickWeight)  # Open dataset as a spreadsheet
To inspect structure:
This shows variable types and a preview of values. Help files are available:
2.2 .csv Files
Many datasets will be in .csv format. A tidy or data matrix format requires:
- Each variable in a column
- Each observation in a row
- Each value in its own cell
Steps to save Excel as .csv:
- Enter data with headers in Row 1.
- Go to File > Save As, choose “CSV (Comma delimited)”.
- Click “Yes” on any Excel warnings.
2.3 Importing a .csv File
From a URL:
From local drive:
The dataset will appear in the Environment tab.
2.4 Using RStudio’s Import Feature
You can also go to File > Import Dataset > From Text (base) and choose your .csv file.
2.5 Summarizing Data
Always load mosaic before analyzing:
Basic Summary Format: goal(~ x, data = dataset)
## Rows: 828
## Columns: 4
## $ player   <chr> "Brandon Webb", "Danny Haren", "Chris Snyder", "Edwin Jackson…
## $ team     <chr> "Arizona Diamondbacks", "Arizona Diamondbacks", "Arizona Diam…
## $ position <chr> "Pitcher", "Pitcher", "Catcher", "Pitcher", "First Baseman", …
## $ salary   <dbl> 8500.000, 8250.000, 5250.000, 4600.000, 4500.000, 4185.000, 3…
Histogram of salary:
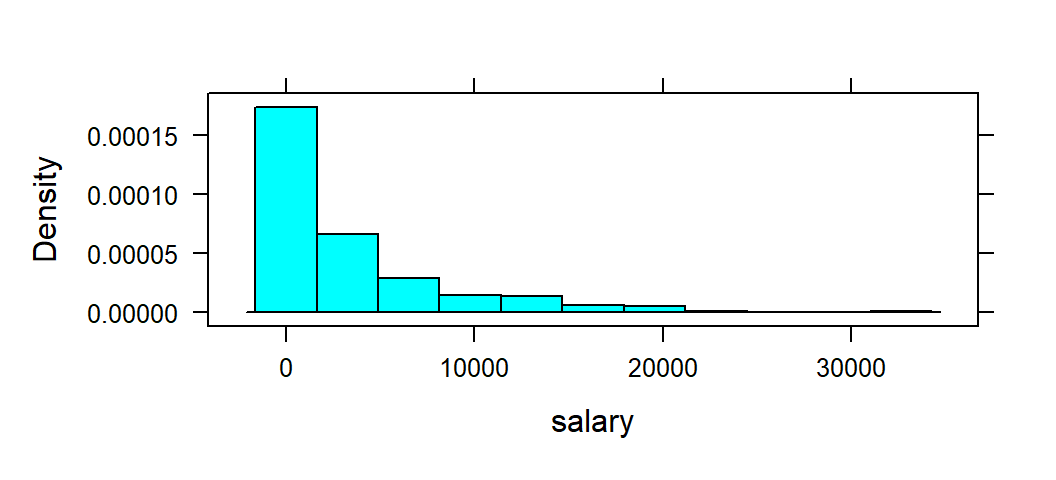
Mean salary:
## [1] 3281.828Groupwise Mean:
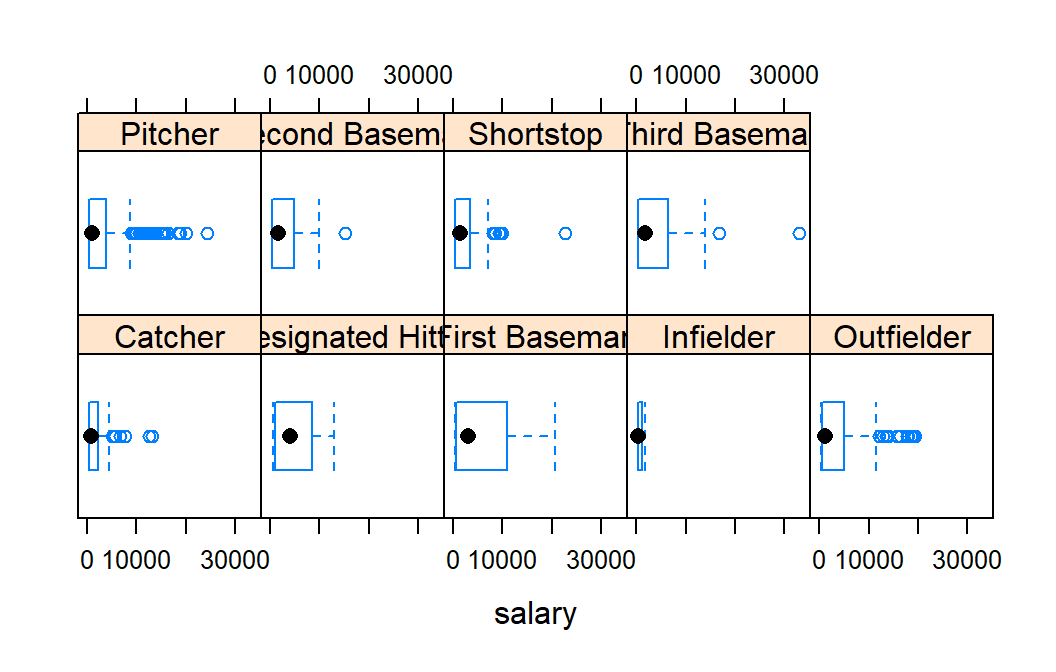
##           Catcher Designated Hitter     First Baseman         Infielder
##          1937.220          5235.714          5826.521           770.575
##        Outfielder           Pitcher    Second Baseman         Shortstop
##          3753.926          2999.197          3022.723          2844.146
##     Third Baseman
##          4641.286
Boxplot by position:
2.6 Exporting Graphs and Output
Export a Plot: Go to Plots > Export, choose your format (Image, PDF, Clipboard).
Export Output: Copy from Console or take a screenshot.
2.7 Extracting Variables
Use $ to extract variables from a dataframe:
## Rows: 31
## Columns: 3
## $ Girth  <dbl> 8.3, 8.6, 8.8, 10.5, 10.7, 10.8, 11.0, 11.0, 11.1, 11.2, 11.3, …
## $ Height <dbl> 70, 65, 63, 72, 81, 83, 66, 75, 80, 75, 79, 76, 76, 69, 75, 74,…
## $ Volume <dbl> 10.3, 10.3, 10.2, 16.4, 18.8, 19.7, 15.6, 18.2, 22.6, 19.9, 24.…